Human Detector
This dashboard will show you Analytic data for Human Detector.Click on Analytics menu, and select Human Detector chart for it.
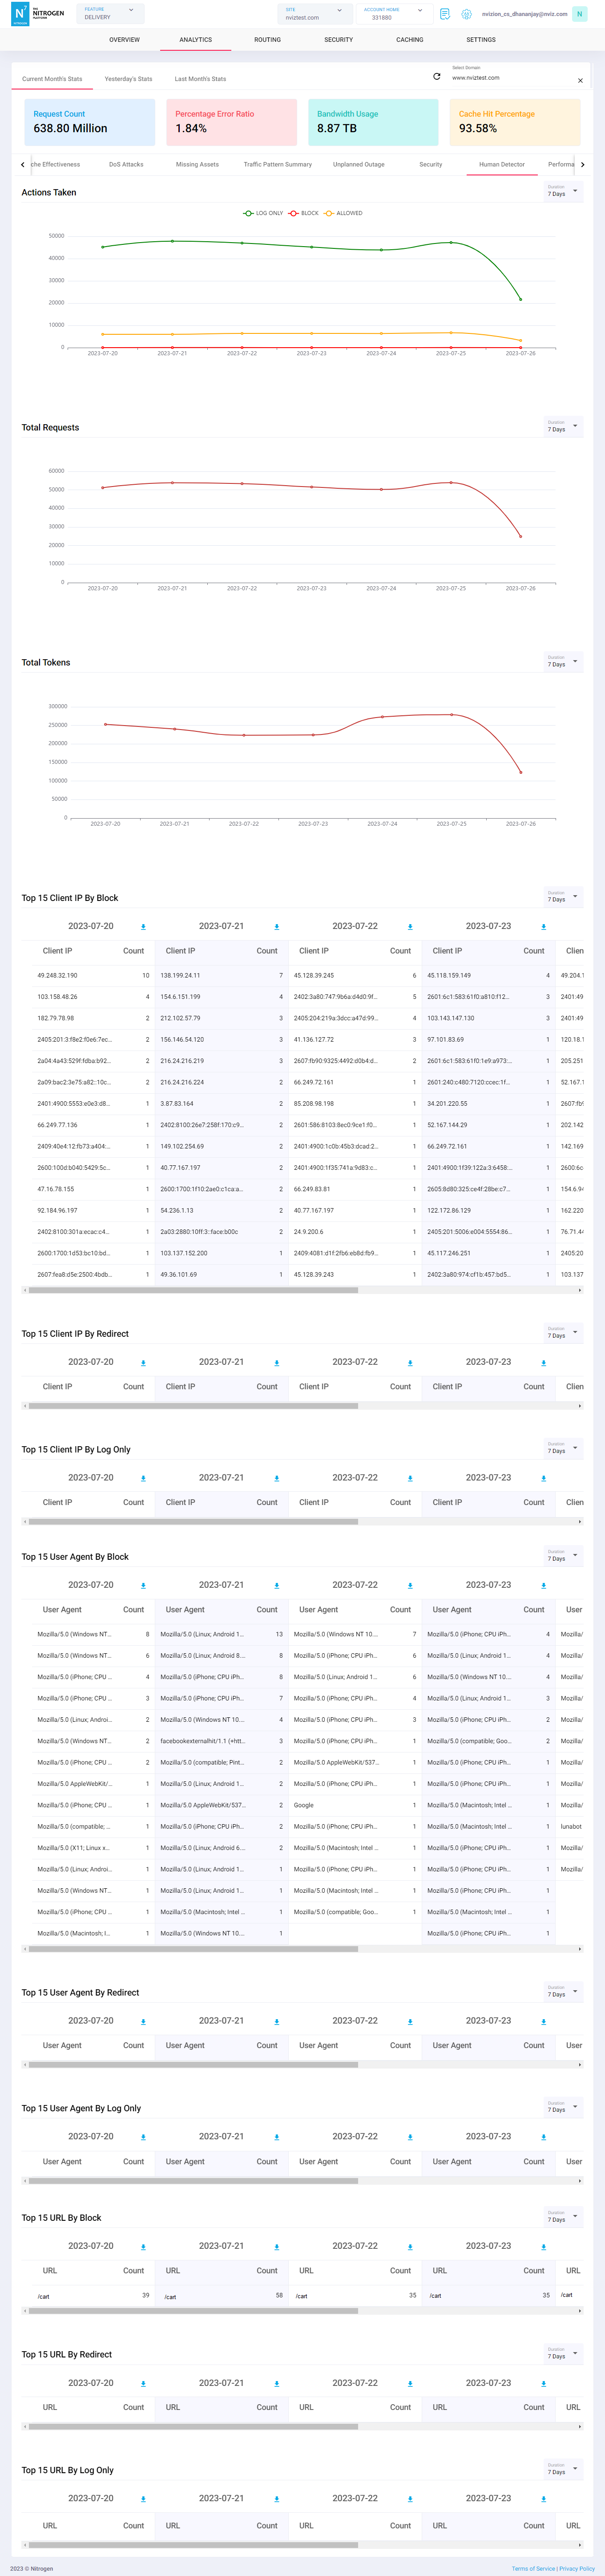
Note: For demo purpose, we will be using www.nviztest.com domain data as an example.
Prerequisite#
- You must have a domain configured on Nitrogen.
- For this example to work, you should have Human-Detector enabled on the domain. If not set, you can refer this article for the same.
Charts#
Actions Taken: This chart shows per day count of occurrences per HD block mode.Total Requests: This chart shows per day count of requests which went through HD.Total Tokens: This chart shows per day count of HD tokens issued.Top 15 Client IP By Block: This table shows top 15 IPs blocked by HD.Top 15 Client IP By Redirect: This table shows top 15 IPs redirected to homepage by HD.Top 15 Client IP By Log Only: This table shows top 15 IPs logged by HD.Top 15 User Agent By Block: This table shows top 15 request-user-agents blocked by HD.Top 15 User Agent By Redirect: This table shows top 15 request-user-agents redirected to homepage by HD.Top 15 User Agent By Log Only: This table shows top 15 request-user-agents logged by HD.Top 15 URL By Block: This table shows top 15 URLs blocked by HD.Top 15 URL By Redirect: This table shows top 15 URLs redirected to homepage by HD.Top 15 URL By Log Only: This table shows top 15 URLs logged by HD.
Notes#
This data is available only if you have domains configured on your site.
This is a domain-specific dashboard, and is shown only after selecting the domain from top-right corner.
This data is available only if you have Human Detector configured on your domain.
These charts are not realtime and can have delay up to 3 hours.