Analytics
This dashboard will show the 4xx status code data for the configured domains.
Note: For demo purpose, we will be using nviztest.com site data as an example.
Prerequisite#
You must have a domain configured on Nitrogen.
You must have AIO enabled on your domain. Refer this article if not done already.
Charts#
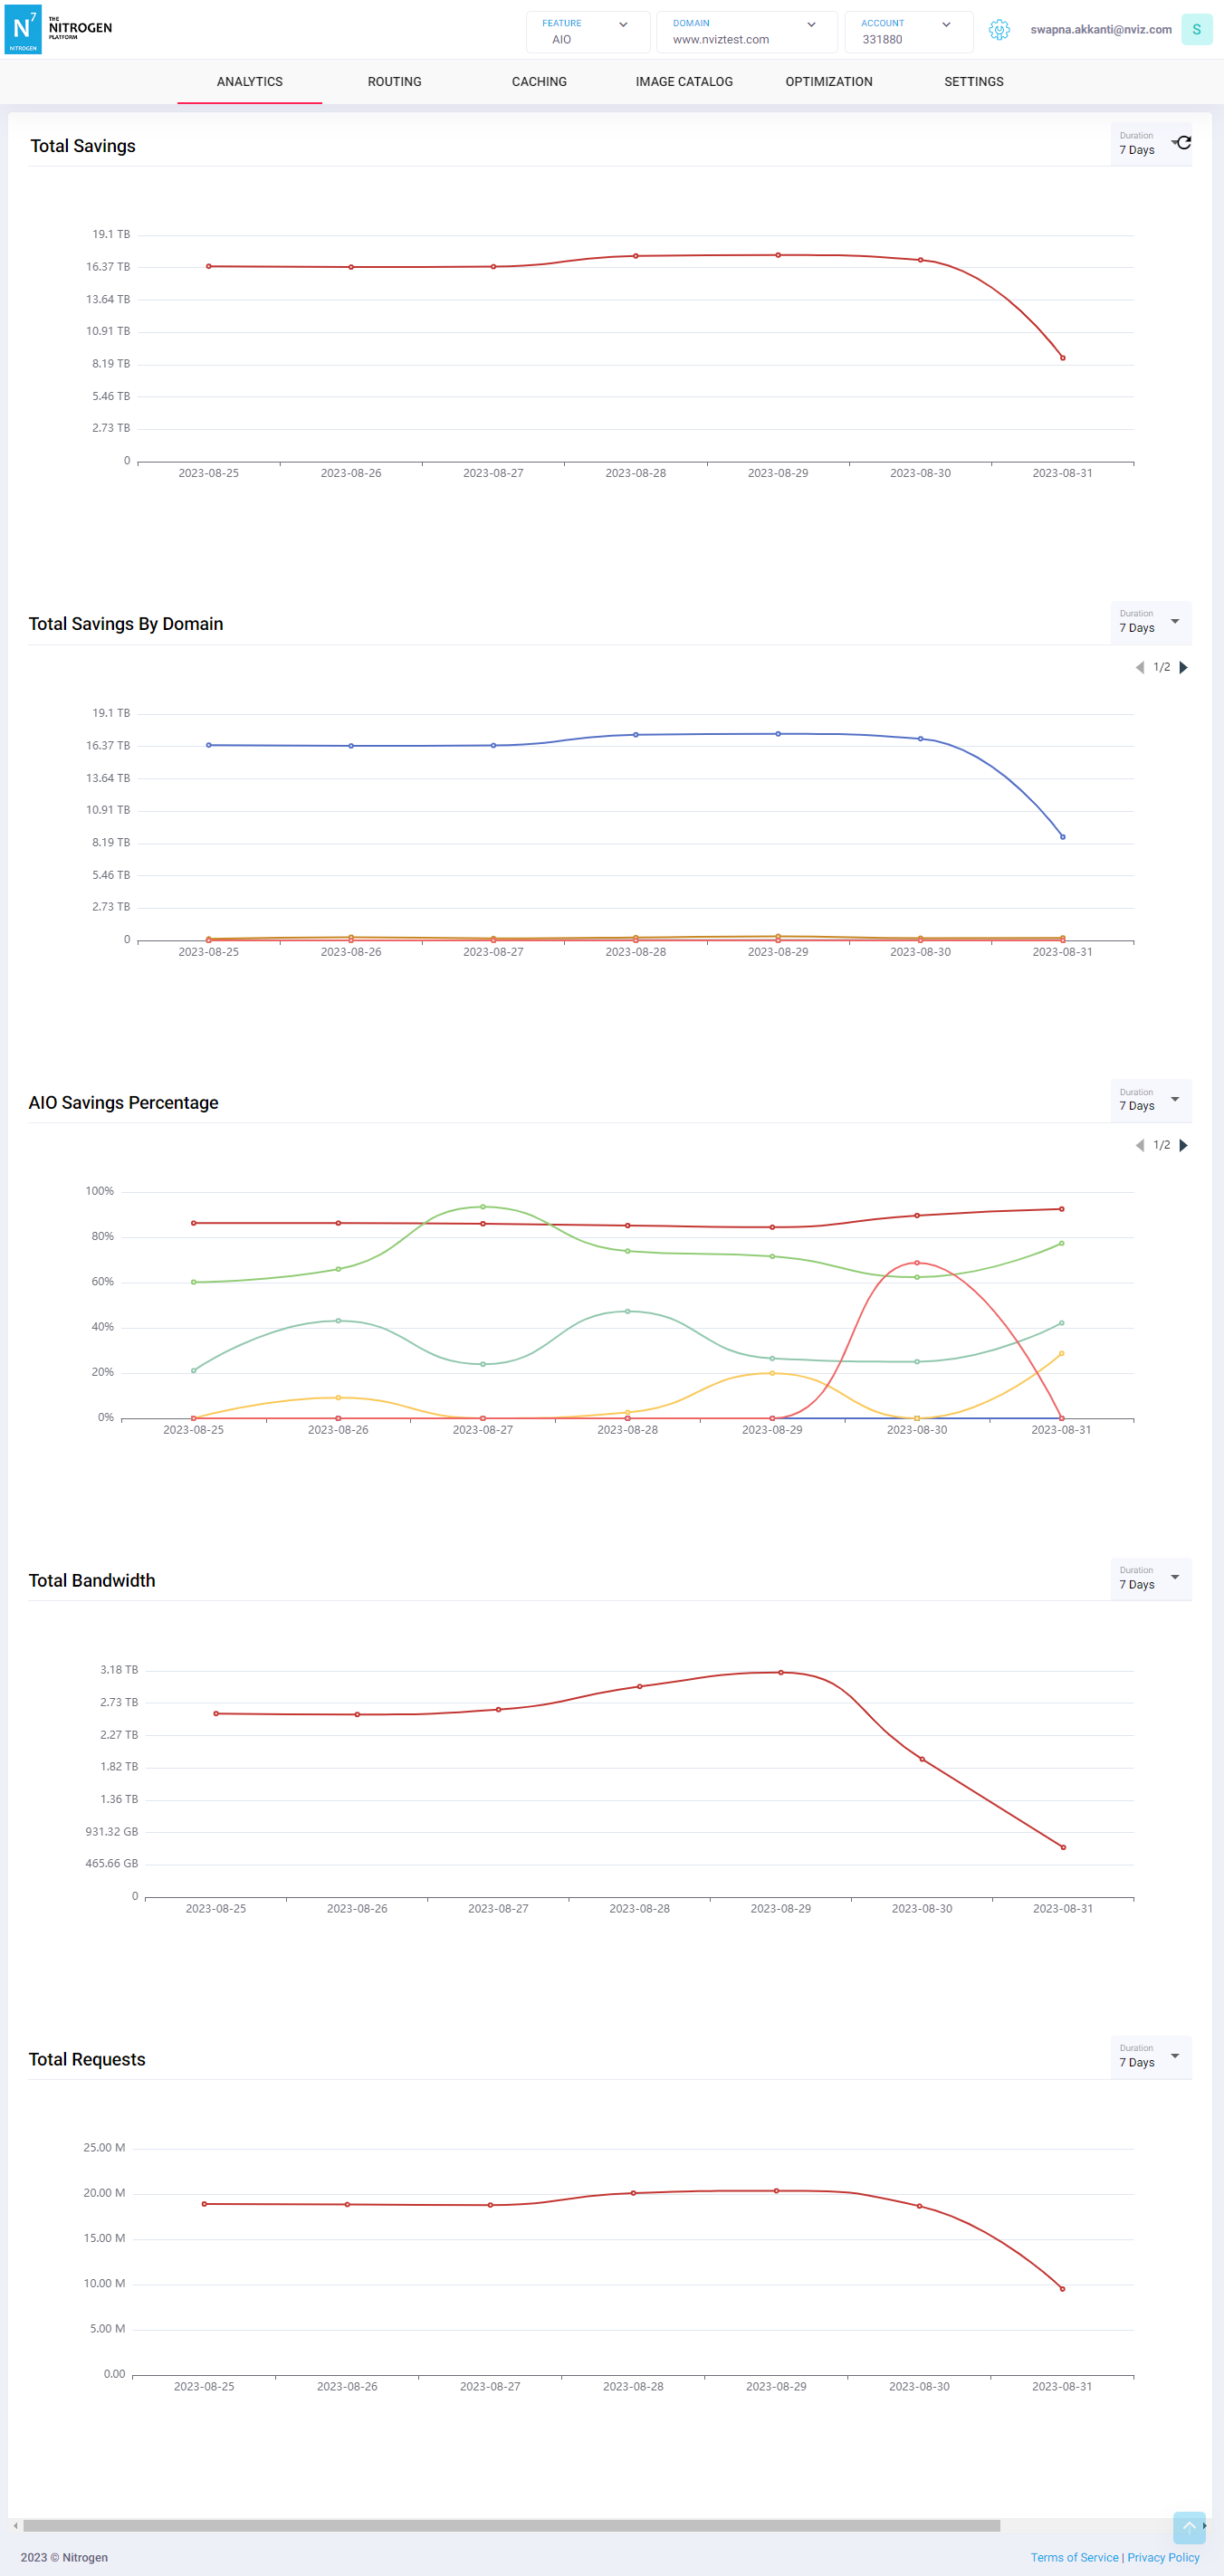
Click on Analytics, you will see following charts:
Total saving: Total bandwidth saved by AIO for all the domains in the current site together.Total saving by domain: Total bandwidth saved by AIO for each domain in the current site.AIO saving percentage: Percentage of total bandwidth saved by AIO for each domain in the current site.Total requests: Total number of requests received by AIO from all the domains in the current site together.Total bandwidth: Total bandwidth for all requests received by AIO from all the domains in the current site together.
Notes#
This data is available only if you have domains configured on your site.
This is a domain-specific dashboard, and is shown only after selecting the domain from top-right corner.
This data is available only if you have AIO configured on your domain.
These charts are not realtime and can have delay up to 3 hours.