RDX Settings
This page will show you how can you change the RDX settingsNote: For demo purpose, we will be using www.nviztest.com domain as an example.
Prerequisite#
- You must have RDX configured on your domain. If not, please refer this article for the same.
Sections#
Click on RDX Settings menu. Then select appropriate domain from the domains dropdown. You will be shown following sections:
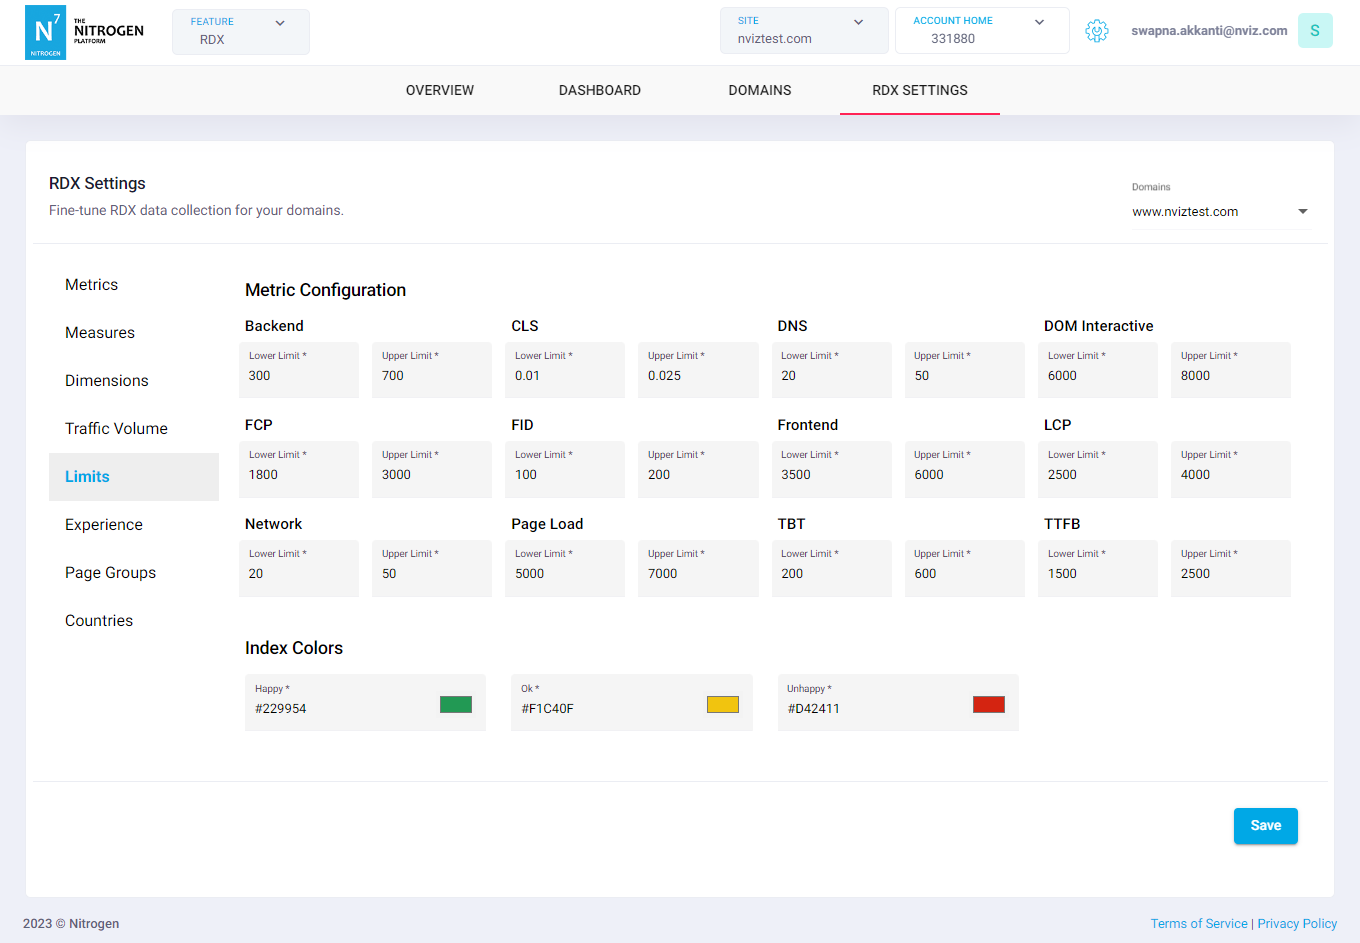
Metrics: Here you can provide the color of your choice to the metric which will be shown in the charts.Click on RGB hexcode and choose the desired color from color-picker. Once selected for all, click onSave.Measures: Here you can provide the color of your choice to the measures which will be shown in the charts.Click on RGB hexcode and choose the desired color from color-picker. Once selected for all, click onSave.Dimensions: Here you can provide the color of your choice to the dimensions which will be shown in the charts.Click on RGB hexcode and choose the desired color from color-picker. Once selected for all, click onSave.Traffic volume: Here you can provide the color of your choice to the traffic volume which will be shown in the charts.Click on RGB hexcode and choose the desired color from color-picker. Once selected for all, click onSave.Limits: Here you can provide the limits and color of your choice to the metrics when used as Experience Indicator.Metric Configuration: Enter the desired value for limit.Index Colors: Click on RGB hexcode and choose the desired color from color-picker.
Click on
Savebutton to save the changes. Now, inOverviewtab’sExperiencechart:- Any value less than Lower Limit will be shown as Happy with the selected color.
- Any value greater than Upper Limit will be shown as Unhappy with the selected color.
- Any value between the Lower and Upper Limit will be shown as Ok with the selected color.
Limits: Here you can provide the limits and color of your choice to the metrics when used as Experience Indicator.Metric Configuration: Enter the desired value for limit.Index Colors: Click on RGB hexcode and choose the desired color from color-picker.
Click on
Savebutton to save the changes. Now, inOverviewtab’s charts:- Any value less than Lower Limit will be shown as Happy with the selected color.
- Any value greater than Upper Limit will be shown as Unhappy with the selected color.
- Any value between the Lower and Upper Limit will be shown as Ok with the selected color.
Experience: Select the desired metric to be set as Experience Indicator.Note: By default RDX Index is selected which uses a complex algorithm to determine the Happiness Index based on the values of all other metric values. We recommend to not change it.Page Groups: You can configure the page-groups here using regexes fr URL patterns. These will be shown in charts when selected.Note: The order of Regexes is very important. The group’s pattern that matches first will be set for the request.Countries: You can configure the countries that can be used in filters while configuring the charts.