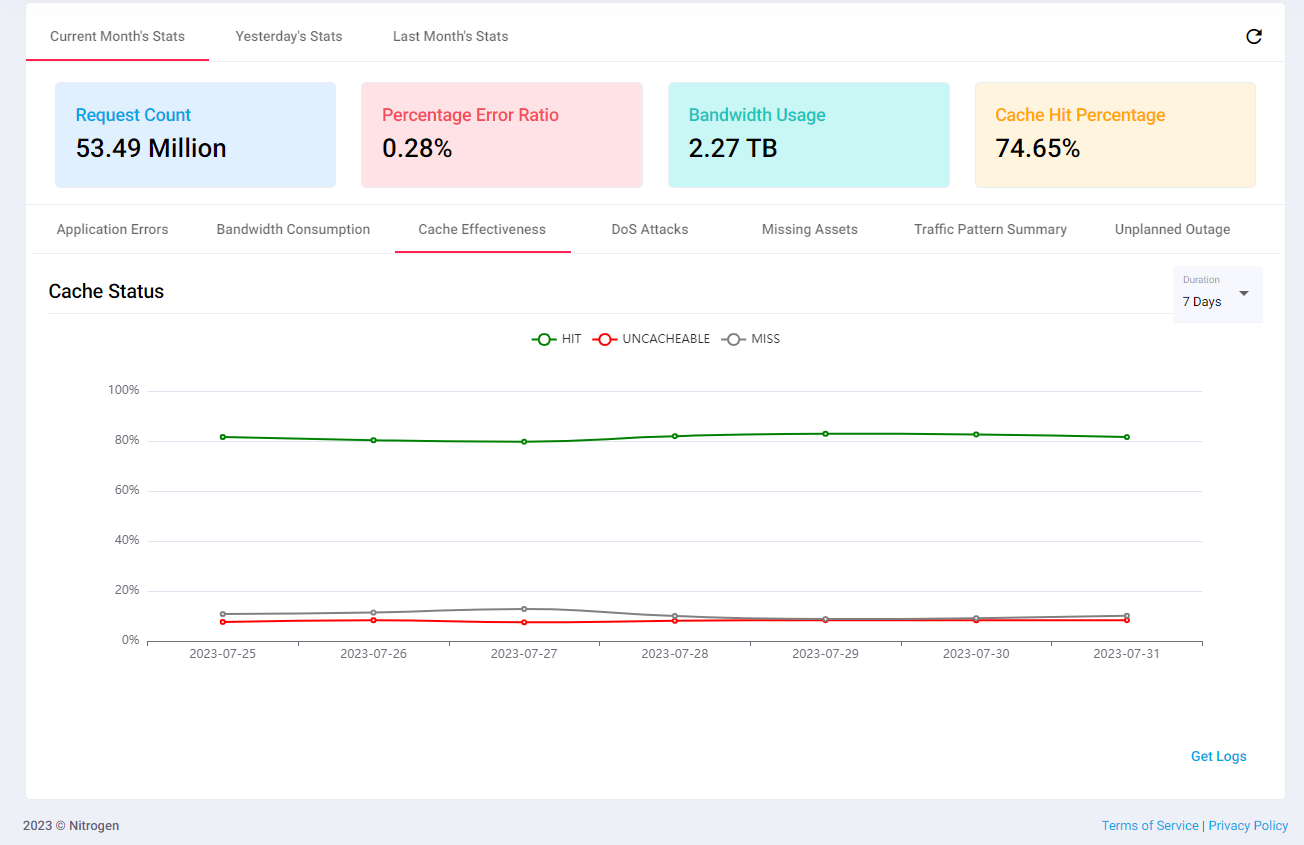
Cache Effectiveness
This dashboard will show the Cache HIT percentage data for the configured domains.
Click on Analytics menu, and select Cache Effectiveness chart for it.
If no domain is selected, the charts will show data of all domains configured on current account. Else data will be displayed for selected domain.
Note: For demo purpose, we will be using nviztest.com site data as an example.
Prerequisite
- You must have a domain configured on Nitrogen.
Charts
Cache Status: This chart shows the Cache HIT percentage for the overall requests.HIT - Cached content being served form N7 CDN.UNCACHEABLE - Requests set to not cache at N7 CDN.MISS - Cacheable requests reached to the Origin to fetch the content.

Notes
-
This data is available only if you have domains configured on your site.
-
These charts are not realtime and can have delay up to 3 hours.
-
If no domain is selected, the charts will show data of all domains configured on current account