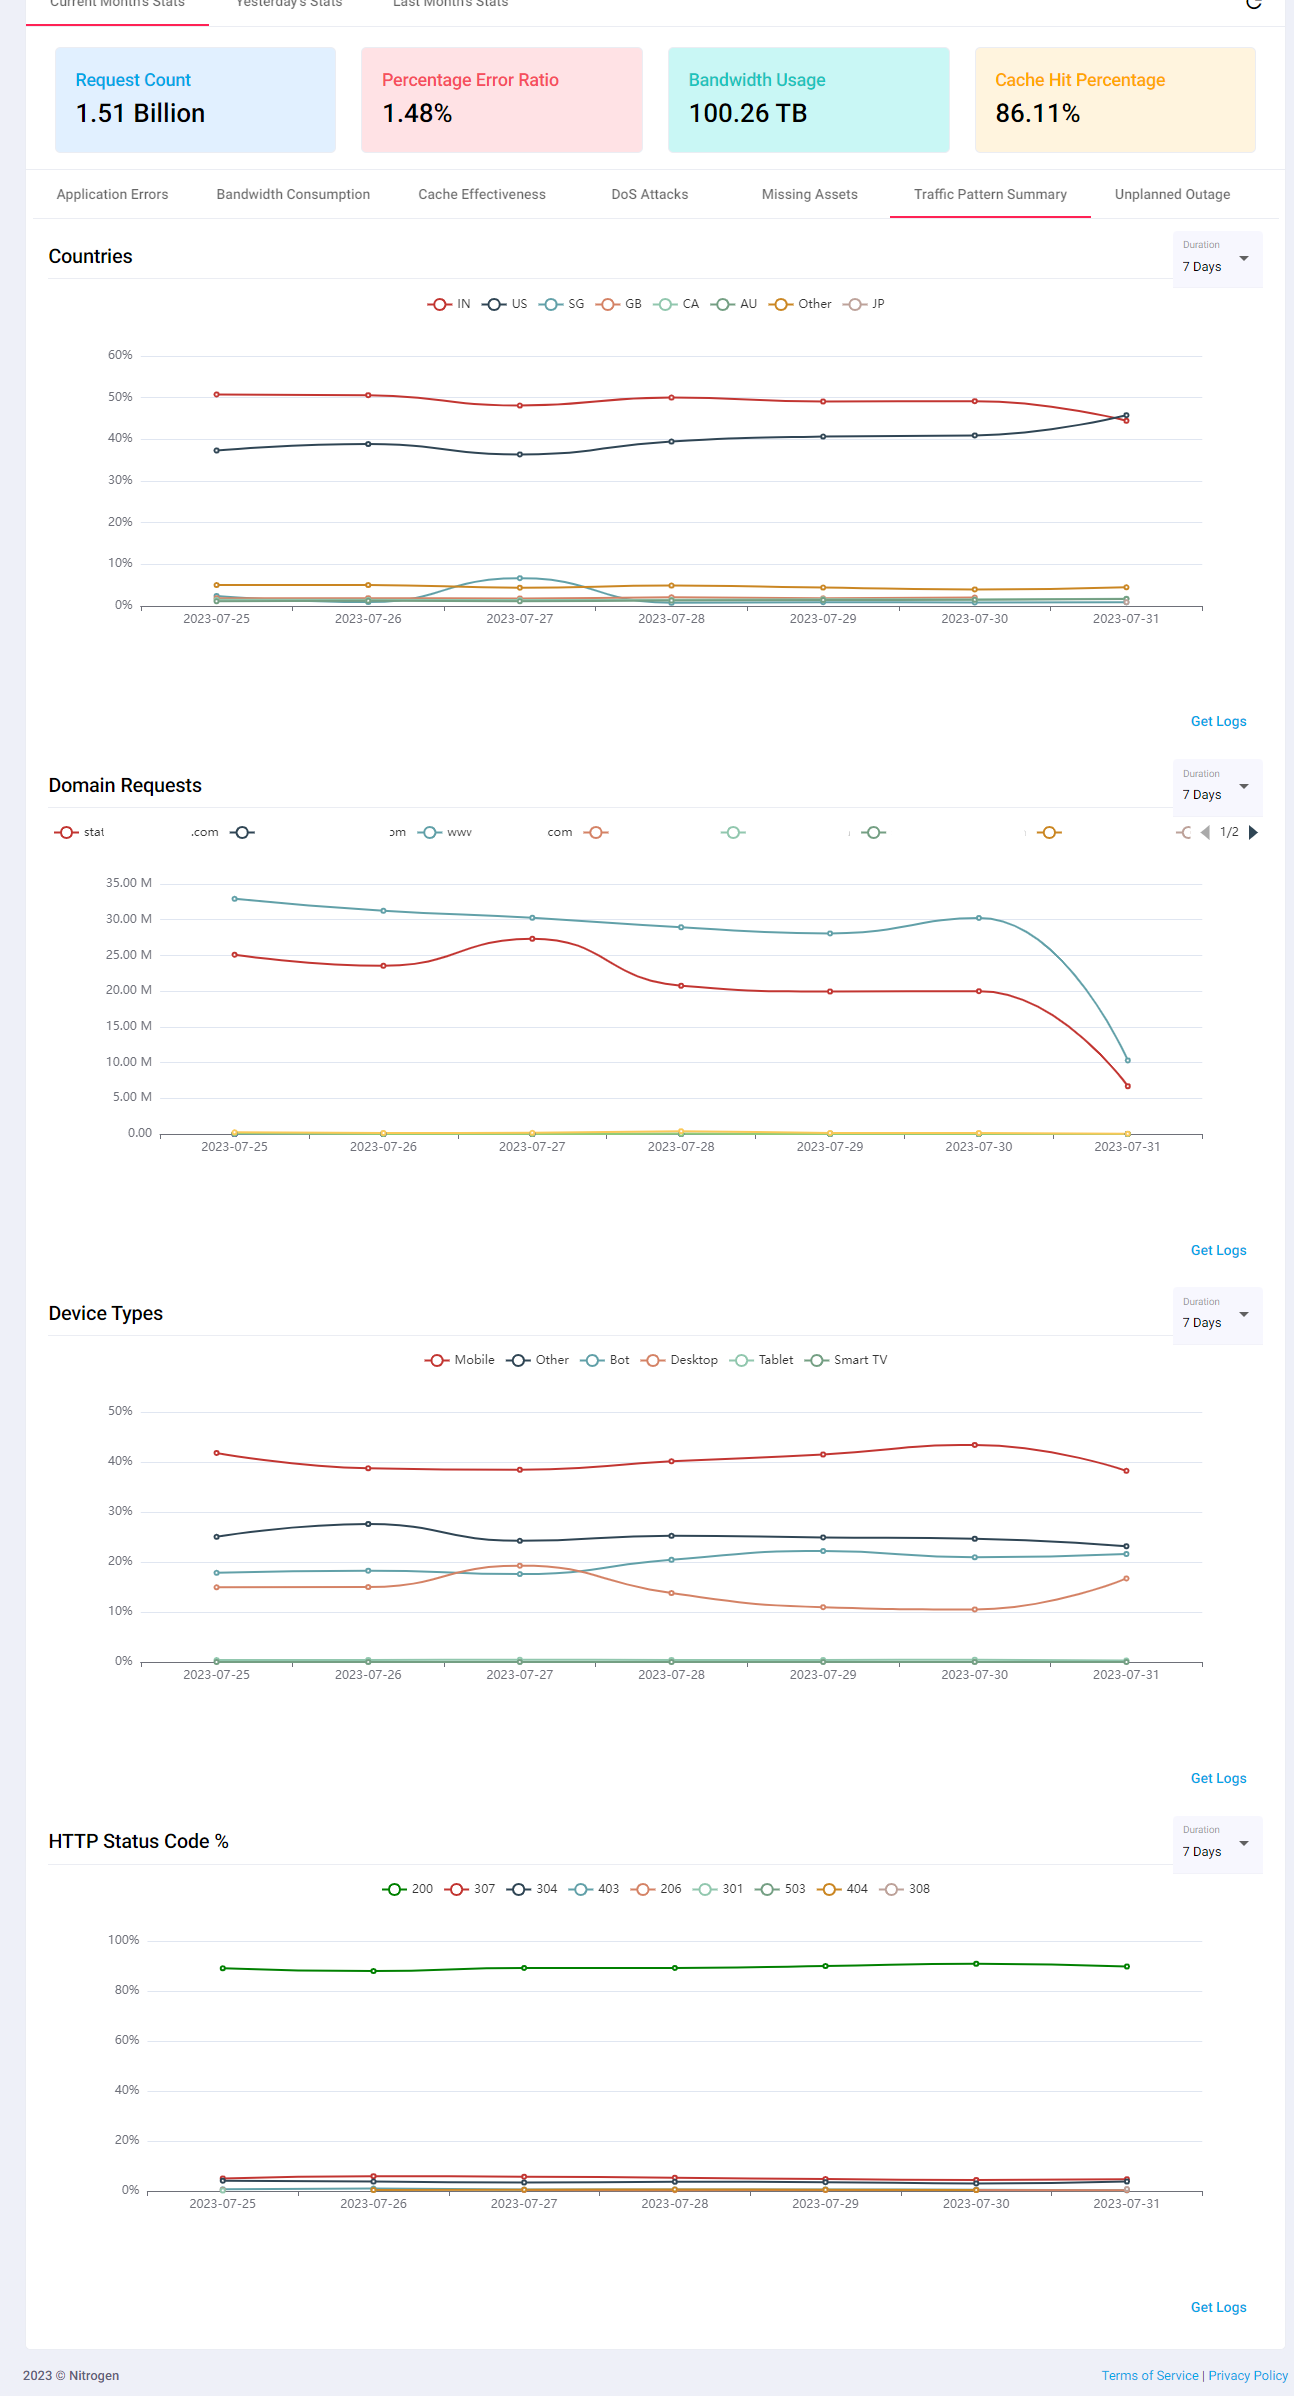
Traffic Pattern Summary
This dashboard will show the input traffic details for the configured domains.
Click on Analytics menu, and select Traffic Pattern Summary chart for it.
If no domain is selected, the charts will show data of all domains configured on current account. Else data will be displayed for selected domain.
Note: For demo purpose, we will be using nviztest.com site data as an example.
Prerequisite
- You must have a domain configured on Nitrogen.
Charts
-
Countries: This chart shows the percentage traffic received from different countries. -
Domain Requests: This chart shows the count of the requests received for the domains configured under your account. -
Device Types: This chart shows the percentage traffic received from different devices. -
HTTP Status Code %: This chart shows the percentage of HTTP status codes of the overall traffic.

Notes
-
This data is available only if you have domains configured on your site.
-
These charts are not realtime and can have delay up to 3 hours.
-
If no domain is selected, the charts will show data of all domains configured on current account