RDX Settings
This page will show you how can you change the RDX settings
Note: For demo purpose, we will be using www.nviztest.com domain as an example.
Prerequisite
- You must have RDX configured on your domain. If not, please refer this article for the same.
Sections
Click on RDX Settings menu. Then select appropriate domain from the domains dropdown. You will be shown following sections:
-
Metrics: Here you can provide the color of your choice to the metric which will be shown in the charts. Click on RGB hexcode and choose the desired color from color-picker. Once selected for all, click onSave. -
Measures: Here you can provide the color of your choice to the measures which will be shown in the charts. Click on RGB hexcode and choose the desired color from color-picker. Once selected for all, click onSave. -
Dimensions: Here you can provide the color of your choice to the dimensions which will be shown in the charts. Click on RGB hexcode and choose the desired color from color-picker. Once selected for all, click onSave. -
Traffic volume: Here you can provide the color of your choice to the traffic volume which will be shown in the charts. Click on RGB hexcode and choose the desired color from color-picker. Once selected for all, click onSave. -
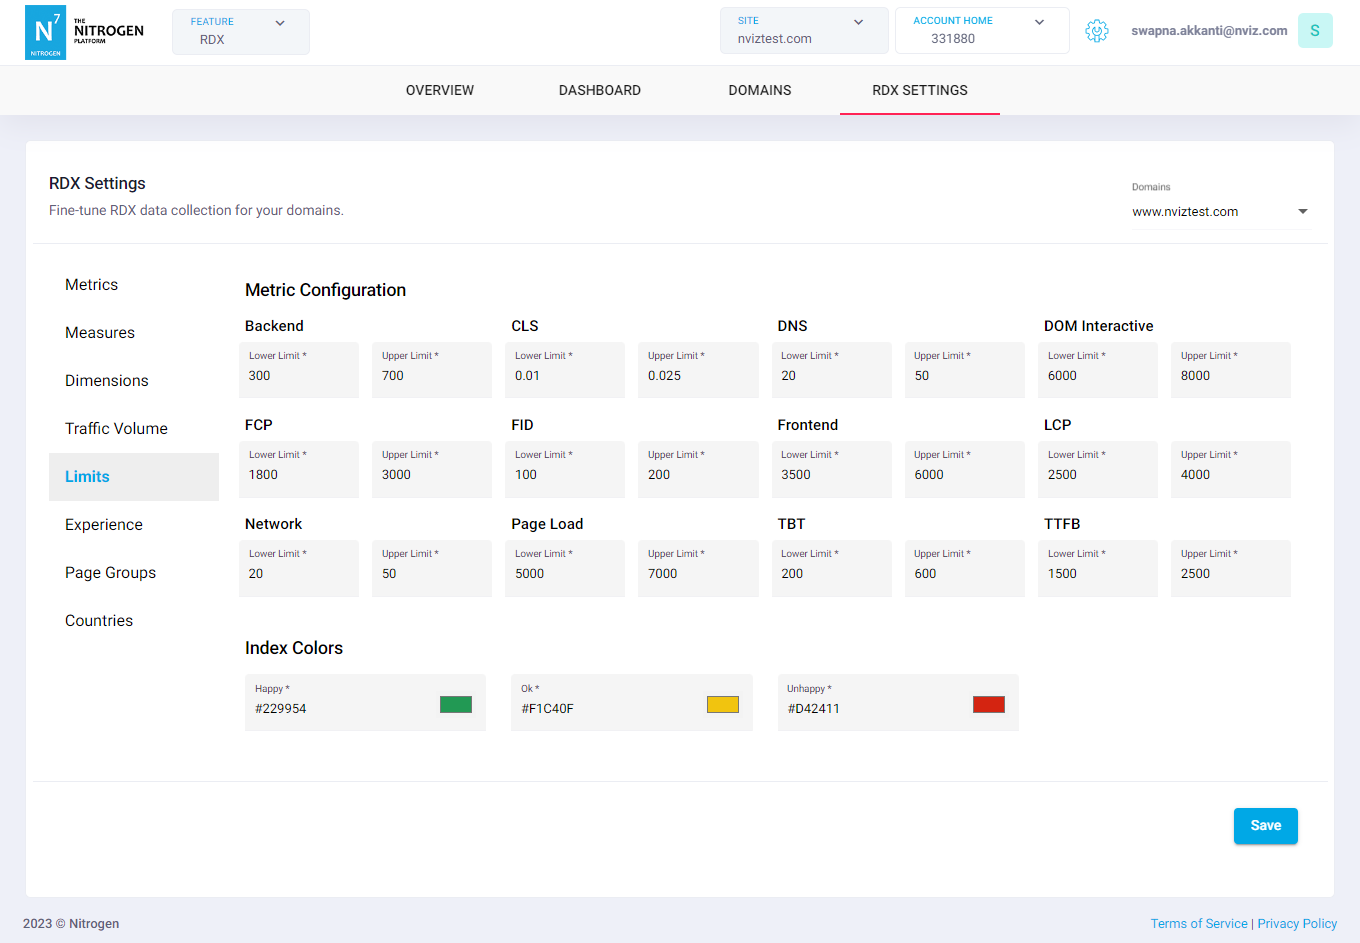
Limits: Here you can provide the limits and color of your choice to the metrics when used as Experience Indicator.Metric Configuration: Enter the desired value for limit.Index Colors: Click on RGB hexcode and choose the desired color from color-picker.
Click on
Savebutton to save the changes. Now, inOverviewtab'sExperiencechart: 1. Any value less than Lower Limit will be shown as Happy with the selected color. 1. Any value greater than Upper Limit will be shown as Unhappy with the selected color. 1. Any value between the Lower and Upper Limit will be shown as Ok with the selected color. -
Limits: Here you can provide the limits and color of your choice to the metrics when used as Experience Indicator.Metric Configuration: Enter the desired value for limit.Index Colors: Click on RGB hexcode and choose the desired color from color-picker.
Click on
Savebutton to save the changes. Now, inOverviewtab's charts: 1. Any value less than Lower Limit will be shown as Happy with the selected color. 1. Any value greater than Upper Limit will be shown as Unhappy with the selected color. 1. Any value between the Lower and Upper Limit will be shown as Ok with the selected color. -
Experience: Select the desired metric to be set as Experience Indicator. Note: By default RDX Index is selected which uses a complex algorithm to determine the Happiness Index based on the values of all other metric values. We recommend to not change it. -
Page Groups: You can configure the page-groups here using regexes fr URL patterns. These will be shown in charts when selected. Note: The order of Regexes is very important. The group's pattern that matches first will be set for the request. -
Countries: You can configure the countries that can be used in filters while configuring the charts.