Dashboard
This page will give you idea of default RDX charts available, and steps to create custom dashboards and to add charts in them.
Note: For demo purpose, we will be using www.nviztest.com domain as an example.
Prerequisite
- You must have RDX configured on your domain. If not, please refer this article for the same.
Sections
Click on Dashboard menu. Then select appropriate domain from the domains dropdown.
Default charts
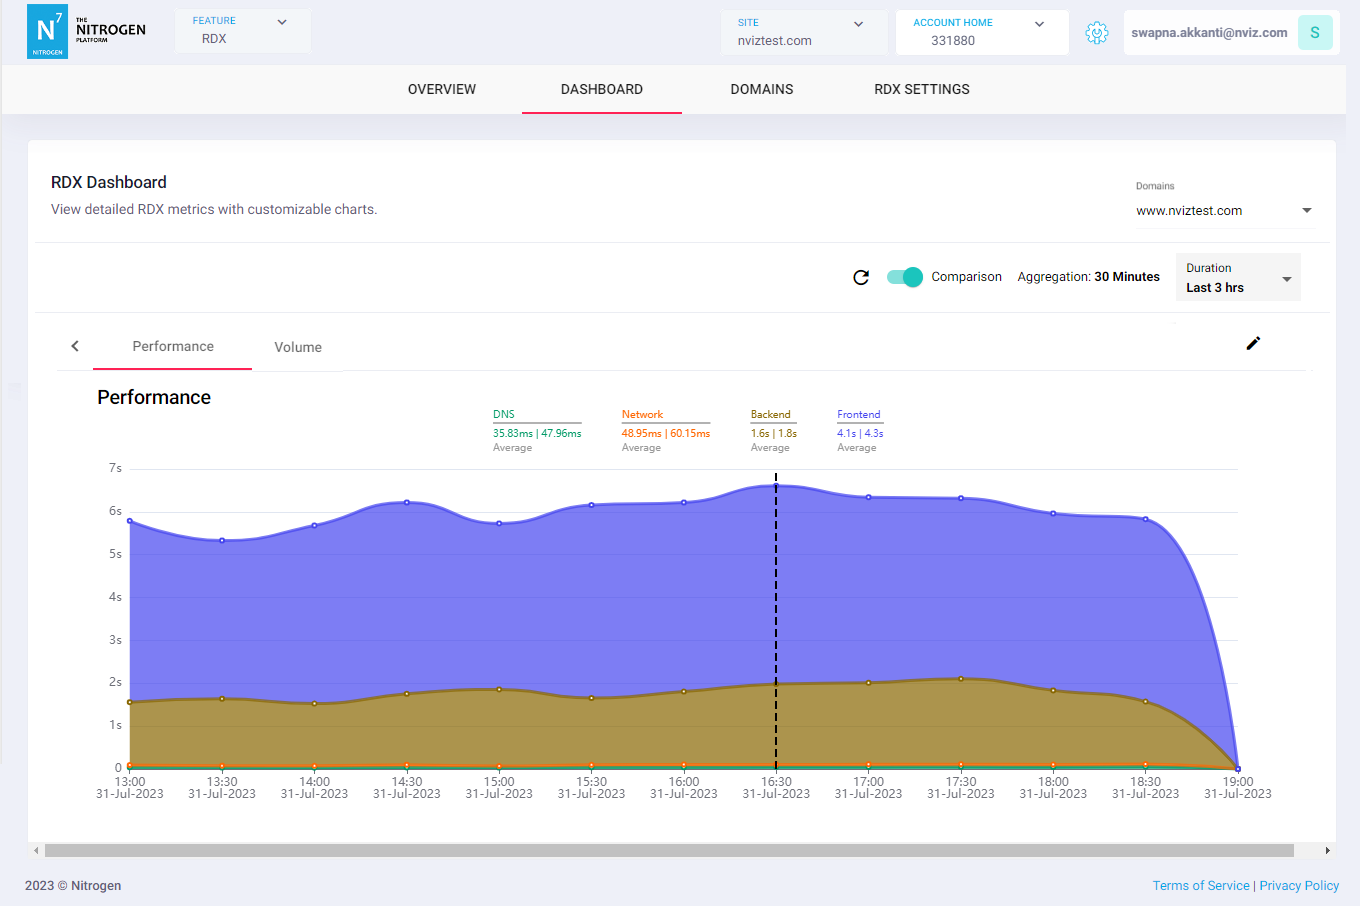
You will see two tabs with default charts.
-
Performance: This dashboard will show you charts related to performance:-
Performance: This chart shows average time taken by various parts of requests such as DNS resolution, Network time, time taken by Backend to respond, time taken by frontend to process it. -
First Contentful Paint: This chart shows average FCP logged for all the requests. -
Largest Contentful Paint: This chart shows average LCP logged for all the requests. -
Time To First Byte: This chart shows average TTFB logged for all the requests.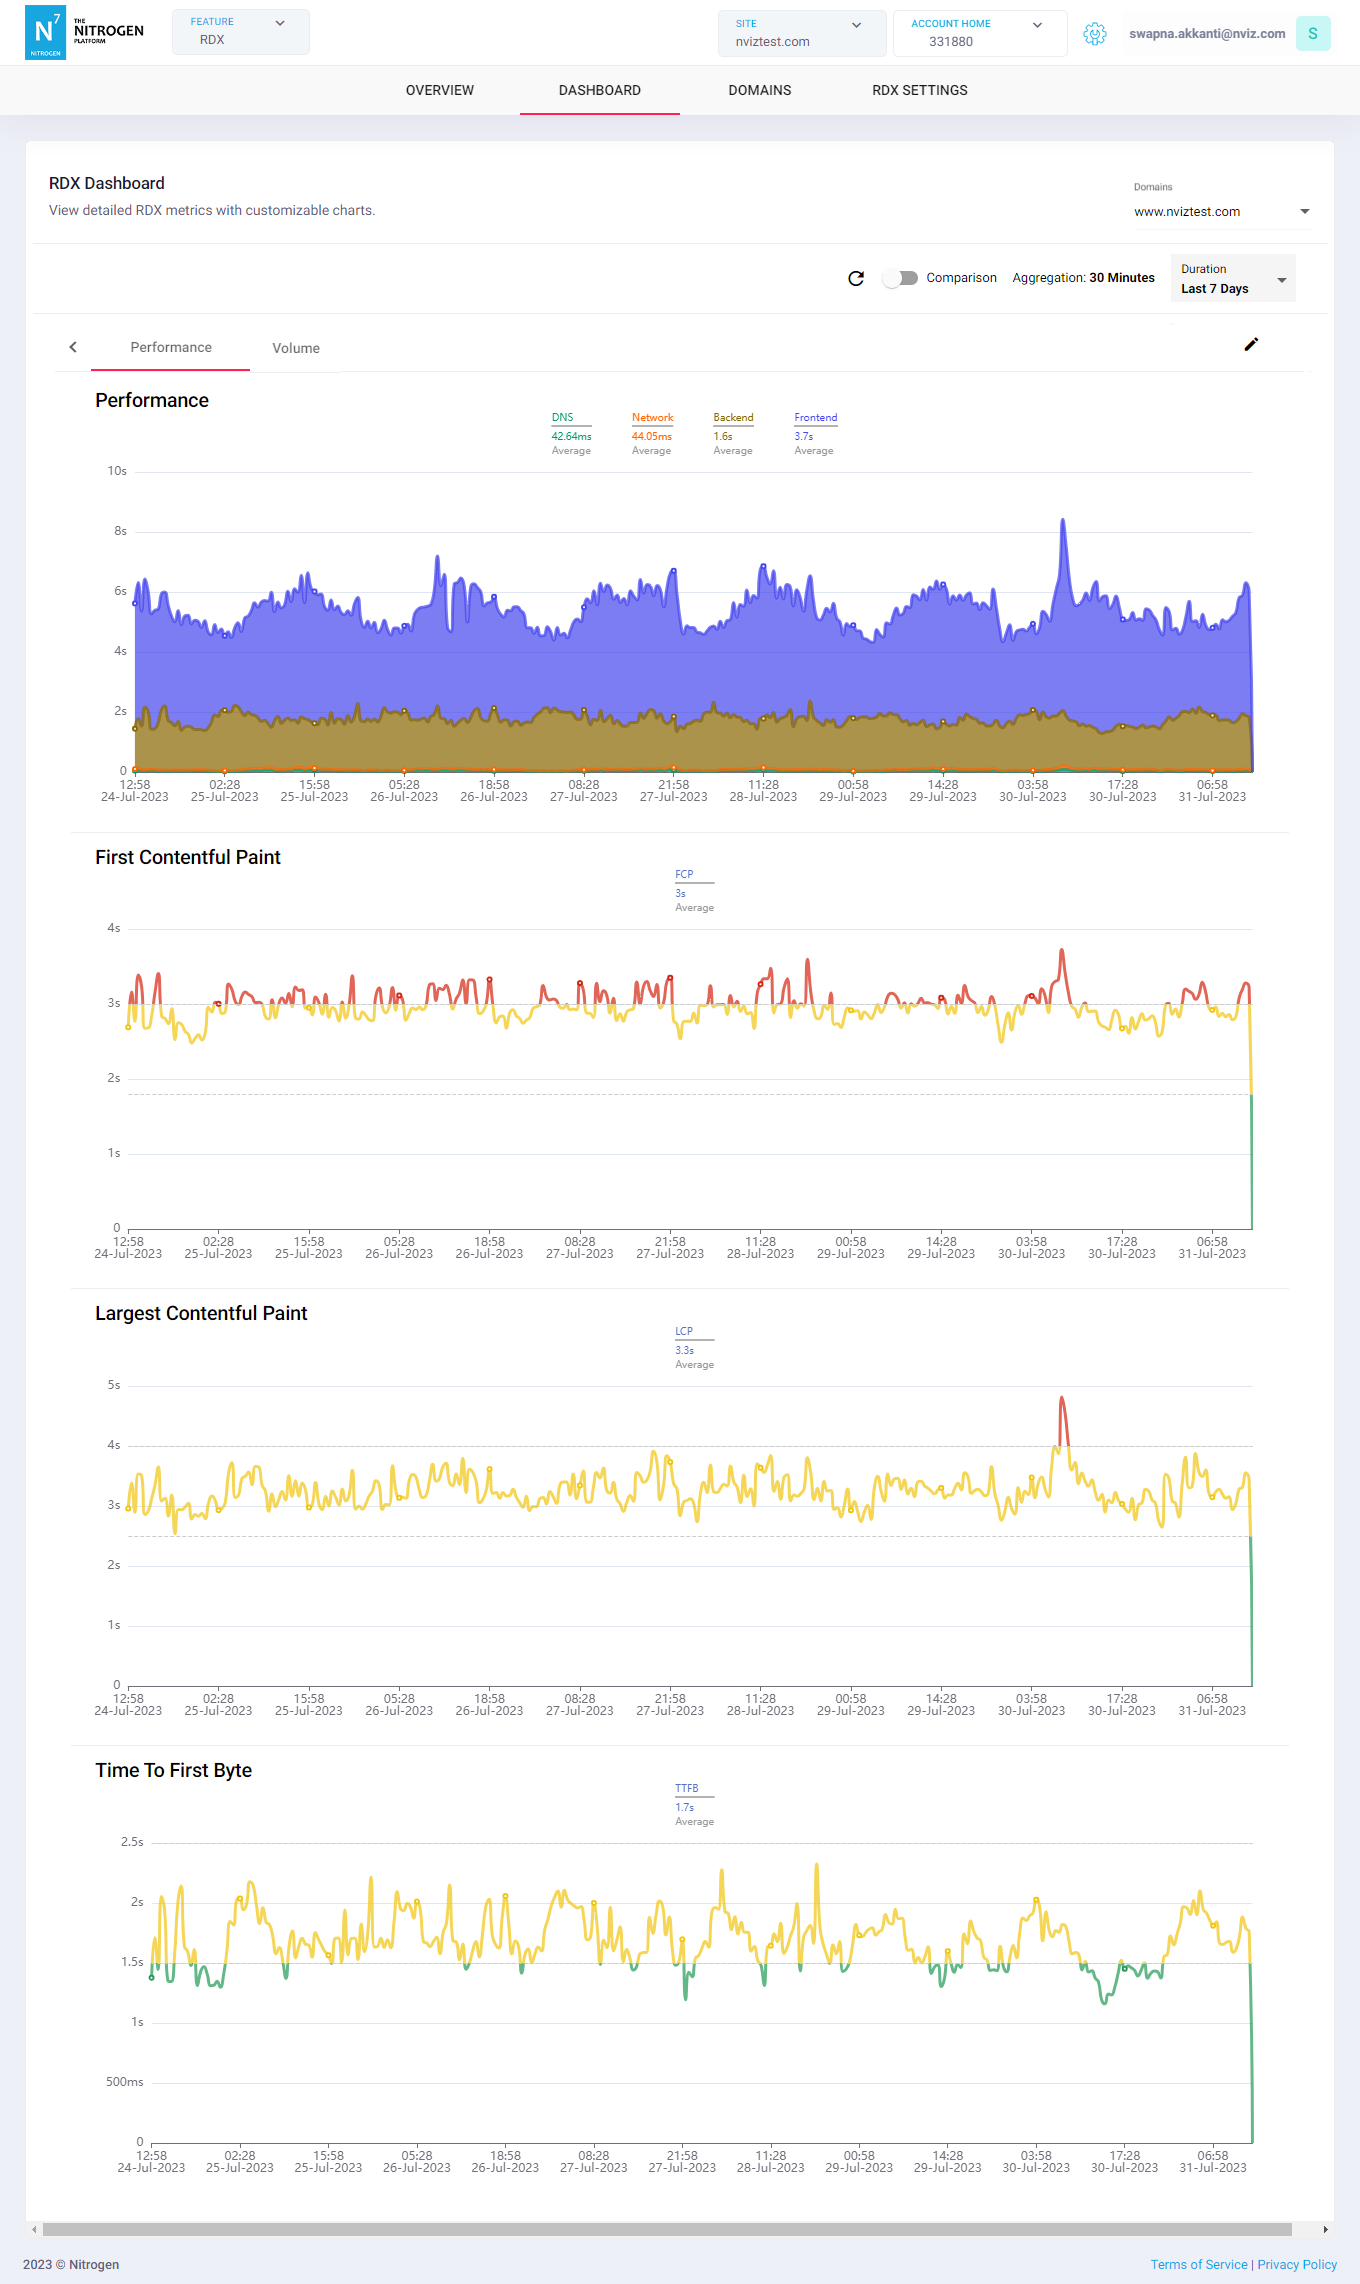
-
-
Volume: This dashboard will show you charts related to request volume:Request Count By Device Type: This chart shows the count of requests received from the different device-types.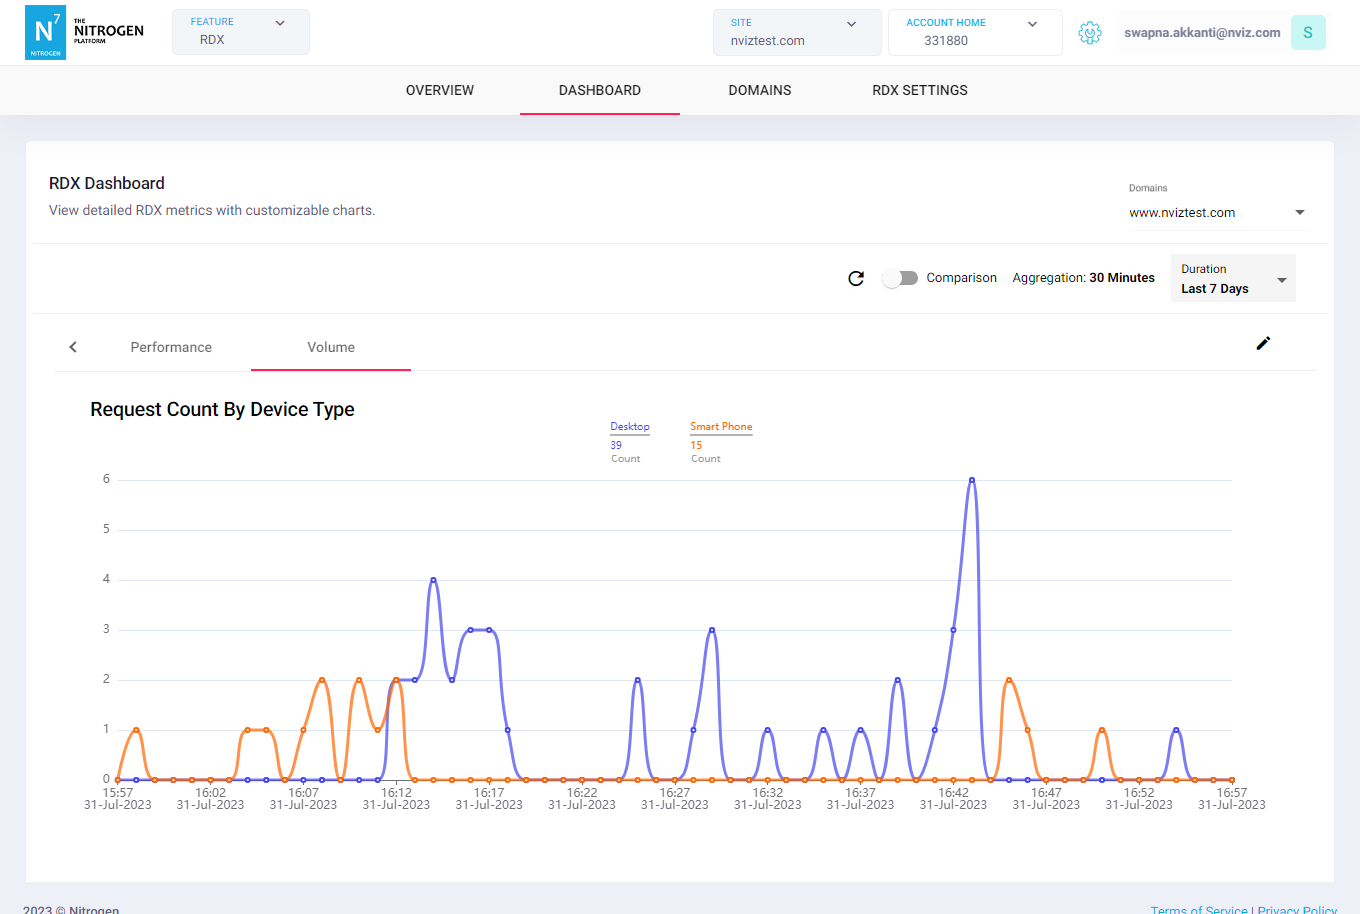
Note: You are not allowed to edit default charts.
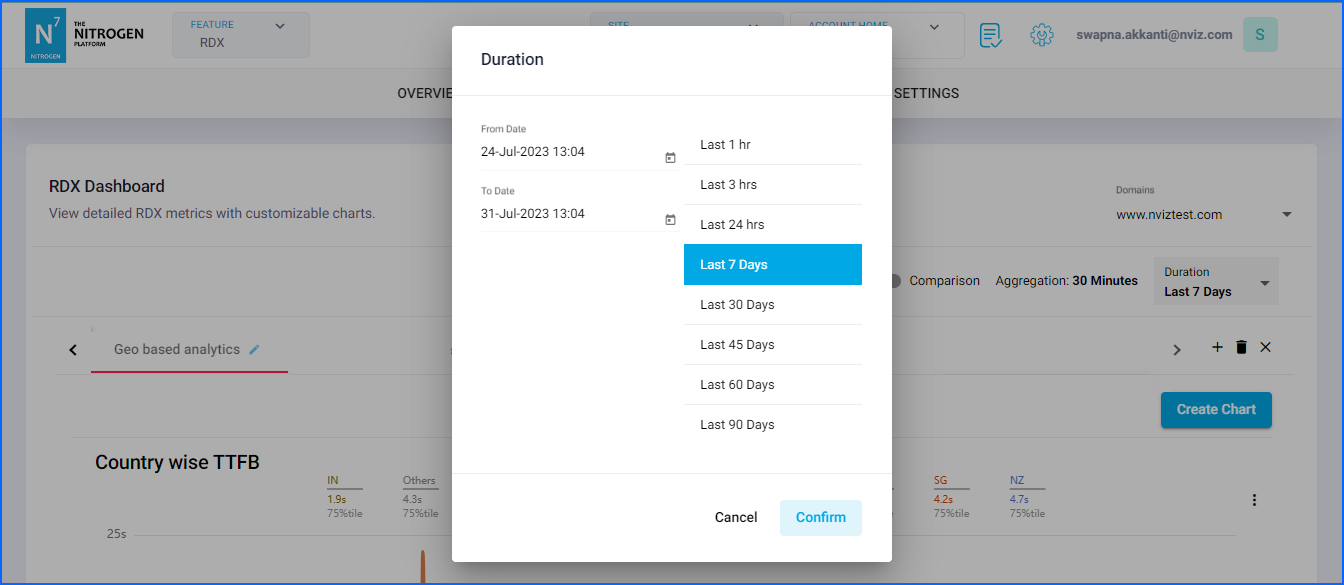
Duration
Use this panel to select duration, for which the data should be fetched and used to plot the chart.
Creating new dashboards
-
Click on the
+button at the top right side belowDomainsdropdown. You will be shown a popup to provide name to the new dashboard.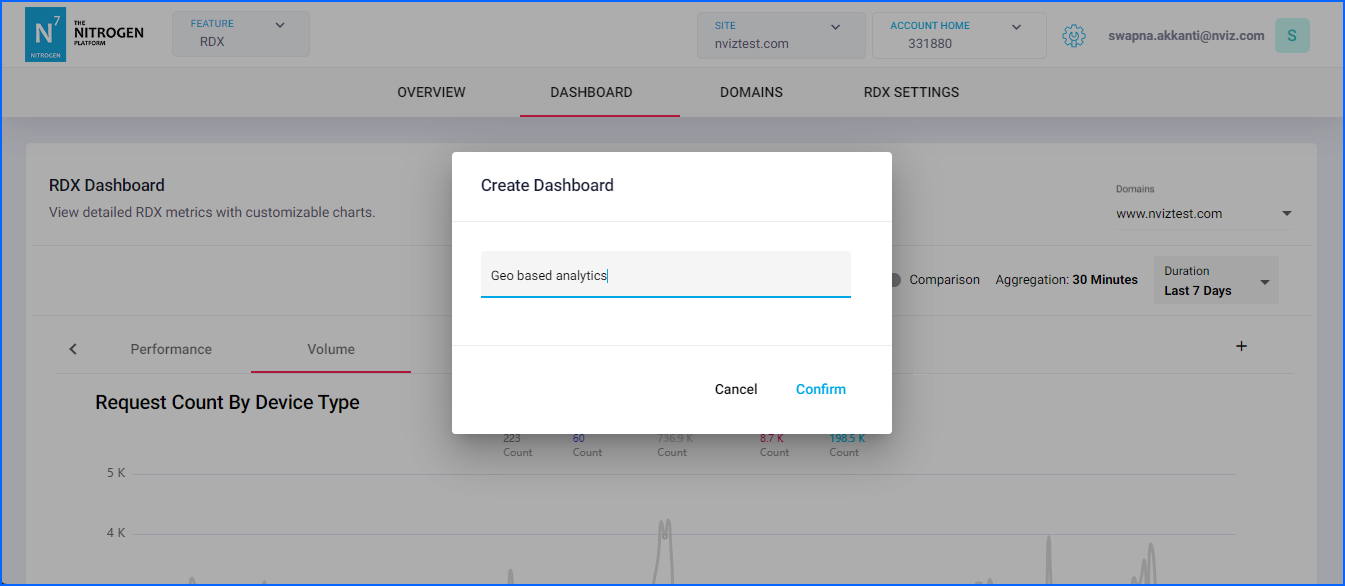
-
Enter desired name and click on
Confirmbutton. A blank dashboard will get created with the given name. Note: Please give a unique, meaningful and relevant name to the dashboard.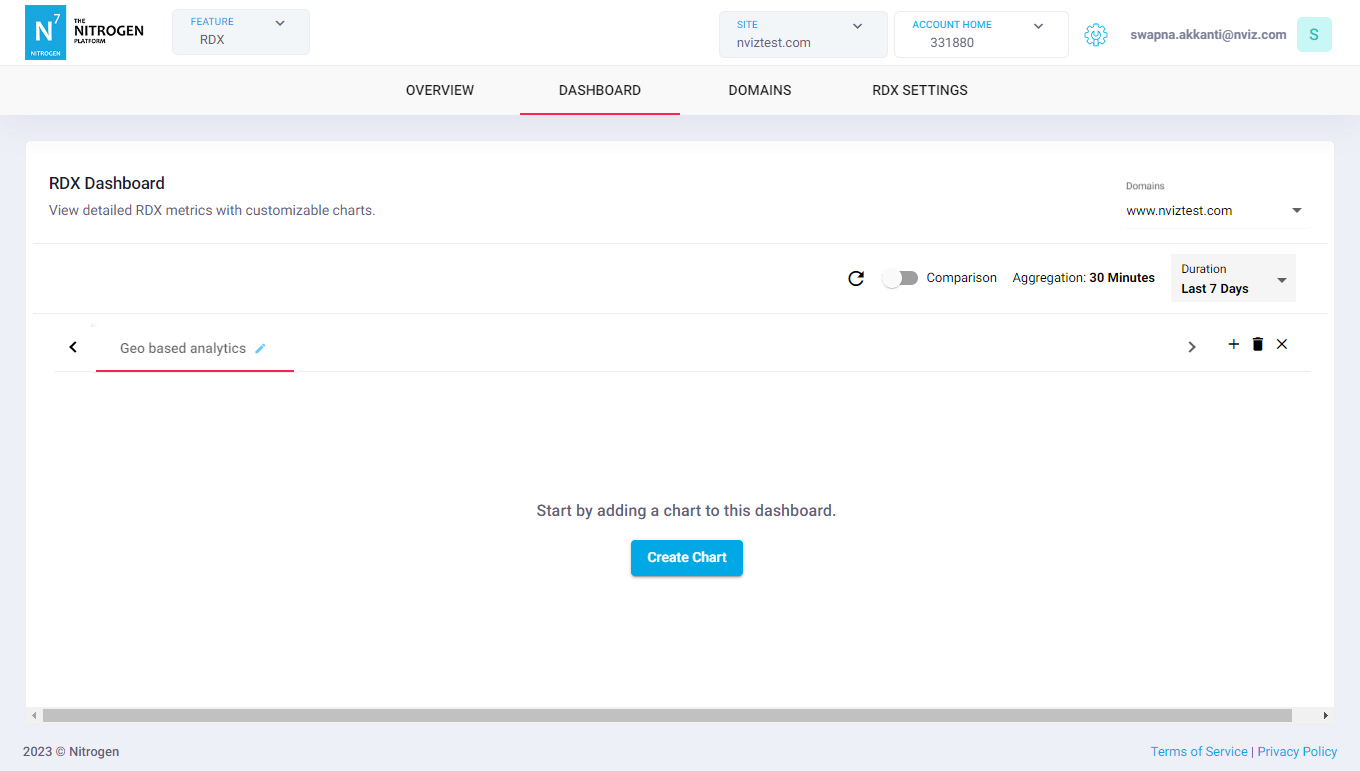
Adding new charts to dashboards
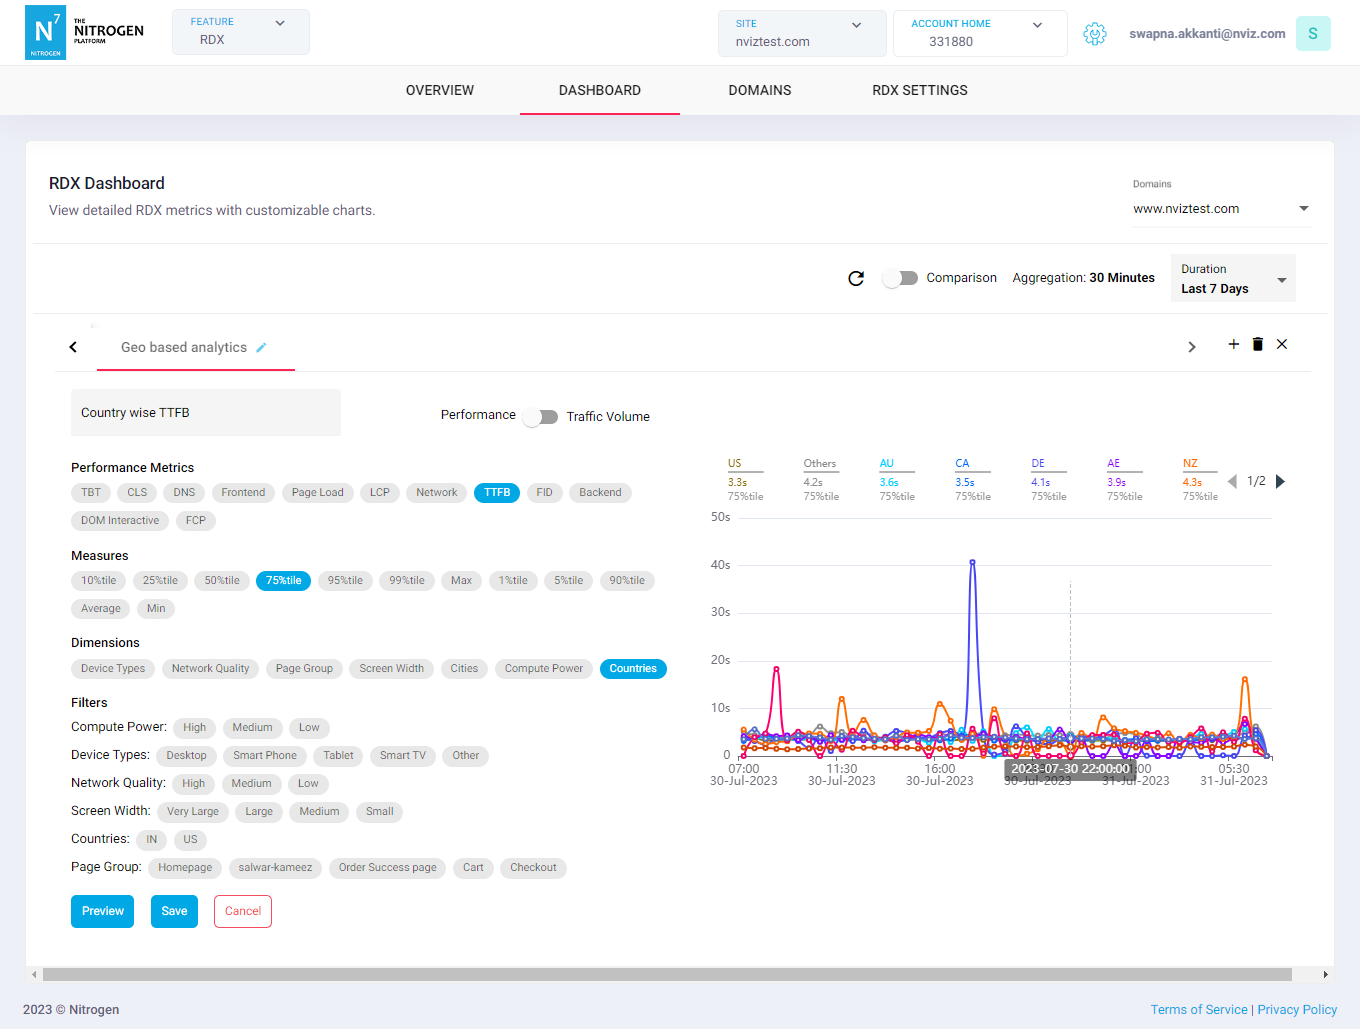
Click on Create Chart button. You will be shown a section to provide chart details. Please provide the required details:
-
Chart Name: name of the chart. Note: Please give a unique, meaningful and relevant name to the chart. -
Chart Type: please select the type of the chart. Based on which the chart creation controls will be shown to you.-
Performance: Selecting this type will provide you the chart creation controls to create Performance charts.-
Performance Metrics: Please select the fields of whose data should be shown in charts.-
FCP: This will show First Contentful Paint logged for the user. -
LCP: This will show Largest Contentful Paint logged for the user. -
CLS: This will show Cumulative Layout Shift logged for the user. -
TBT: This will show Total Blocking Time logged for the user. -
Dom Interactive: This will show time taken by page to get interactive for user for the user. -
DNS: This will show time taken for DNS resolution. -
Network: This will show the network time. -
Backend: This will show time taken by backend to respond. -
Frontend: This will show time taken by frontend to process.
-
-
Measures: Please select the aggregators by which the data should be grouped and shown. -
Dimensions: Please select the fields by which you want to plot the chart lines separately. Notes:-
This field is not-mandatory.
-
If Dimension is selected, you will be shown a separate line aggregated for each selected Metric.
-
If Dimension is not selected, you will be shown single line aggregated for each selected Metric.
-
If any Dimension is selected, only one Measure is allowed to select to reduce the complexity.
-
If Dimension is not selected, you can add as many Measures as you want.
-
-
Filters: Please select any filters for the chart data.-
Compute Power: Requesting device's compute power. -
Device Types: Type of the requesting device. -
Network Quality: Quality of the network from which the request came. -
Screen Width: Screen's width of the device from which the request came. -
Countries: Country from which the request came. By default you will be shown IN and US countries. Please refer this article to configure more. -
Page Group: The category of the request URL. By default this option will not be visible. Please refer this article to configure.
-
-
Preview: Clicking on this button will preview the chart. -
Save: Save the chart to always keep it shown to all dash users with the selected settings. Note:You will not be allowed to save the chart until it is previewed.
-
-
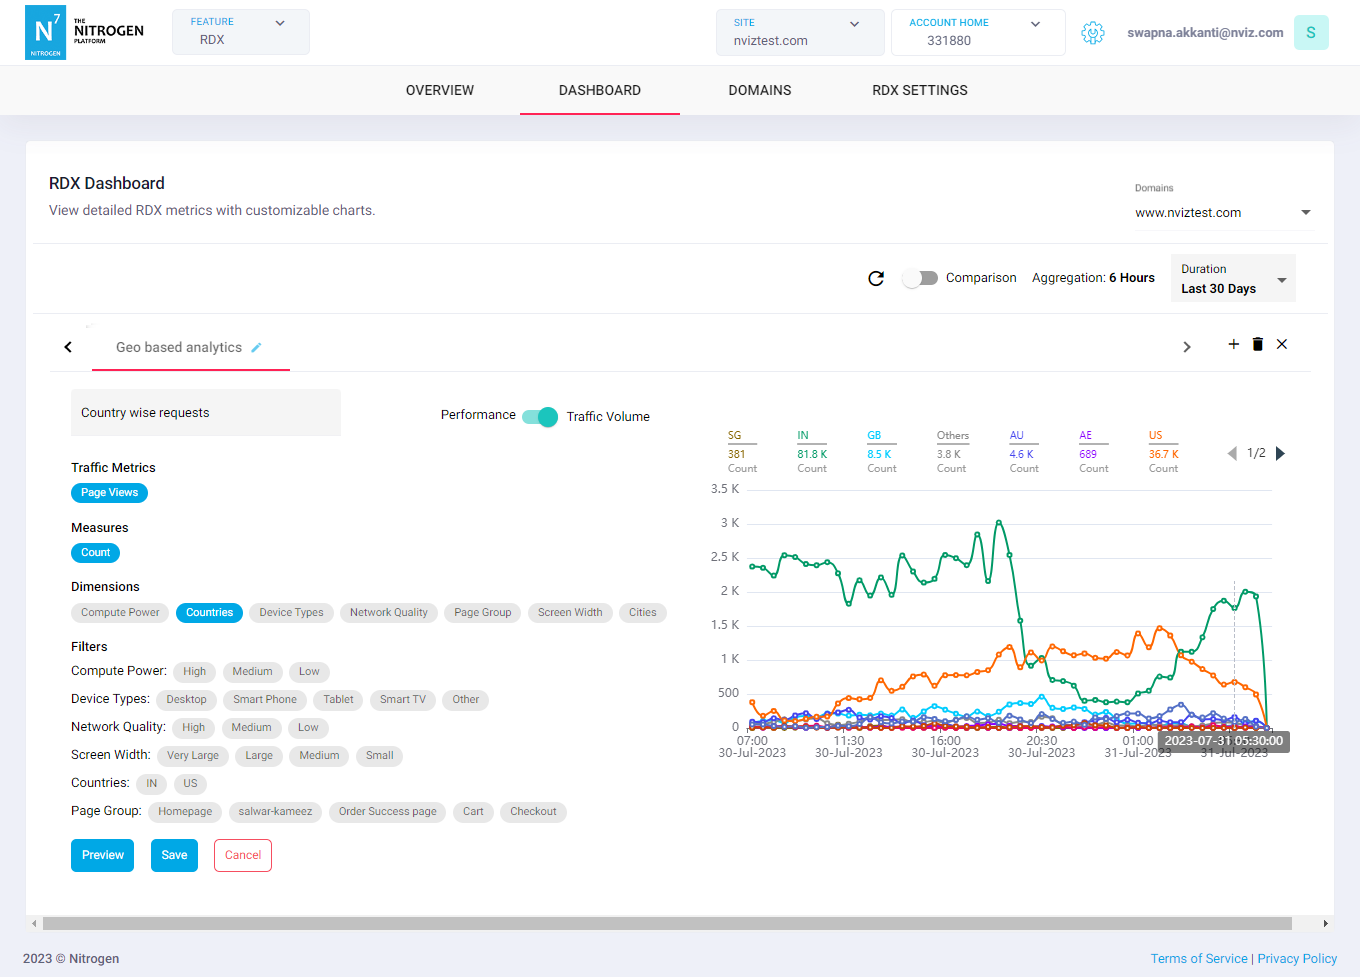
Traffic Volume: Selecting this type will provide you the chart creation controls to create Traffic Volume charts.-
Traffic Metrics: Only the Page Views is available by default. -
Measures: Only the count of the requests is available by default. -
Dimensions: Please select any one field by which you want to plot the chart lines separately. Notes:-
This field is not-mandatory.
-
If any Dimension is not selected, a single chart line will be plotted showing number of requests as per the selected duration.
-
If Dimension is selected, separate lines will be plotted showing number of requests as per the selected Dimension for selected duration.
-
-
Filters: Please select any filters for the chart data.-
Compute Power: Requesting device's compute power. -
Device Types: Type of the requesting device. -
Network Quality: Quality of the network from which the request came. -
Screen Width: Screen's width of the device from which the request came. -
Countries: Country from which the request came. By default you will be shown IN and US countries. Please refer this article to configure more. -
Page Group: The category of the request URL. By default this option will not be visible. Please refer this article to configure.
-
-
Preview: Clicking on this button will preview the chart. -
Save: Save the chart to always keep it shown to all dash users with the selected settings. Note:You will not be allowed to save the chart until it is previewed.
-
-
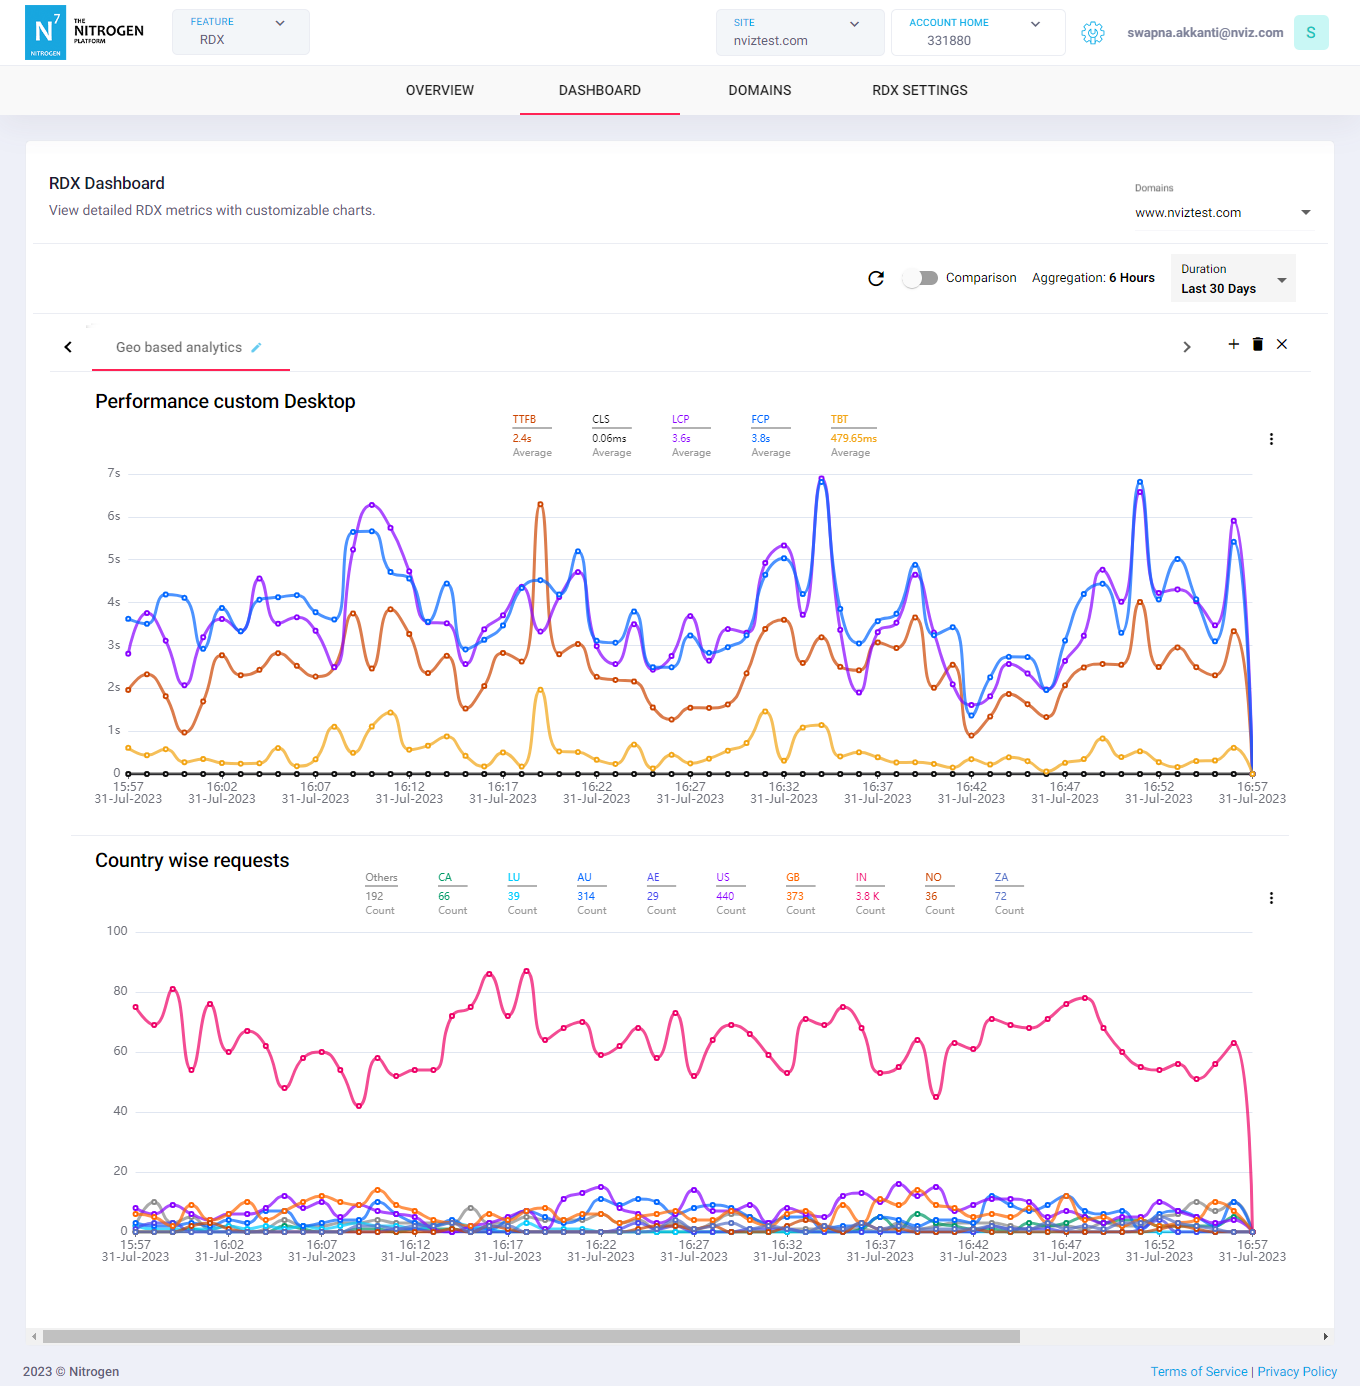
On saving the charts, now the dash users having access to the current domain will be able to see those. Note: You cannot edit or delete the default dashboard or its charts.
-
Comparison
Use this toggle to compare all the charts before and after the selected Duration.
Note: This is useful when you have made some major changes, and need to check its performance impact.
Notes
- RDX data display is not real-time. It may take around 20 minutes for the data to get synced.